 ETTSPL
ETTSPL
ETTSPLWhat is color?
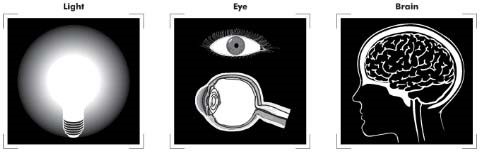
Without light there is no color: Light falls on an object and, depending on the color of the object, is partially absorbed. The light that is not absorbed is reflected and falls on the color receptors in the eye. These convert the incident light into stimuli, which are then sent via nerves to the brain. Here the stimuli are interpreted, and a color perception is formed.
With regard to sensory perception: each person “experiences” color differently. This is not just because no two eyes are identical, but also because color interpretation also varies from person to person. The same person can even perceive colors differently at different times and according to the mood he or she is in.
Many people perceive colors independently of light. For example, in one form of synesthesia where colors are heard notes, harmonies and music are linked with certain colors: high notes mostly with light colors and low notes with dark colors.
How is color defined?
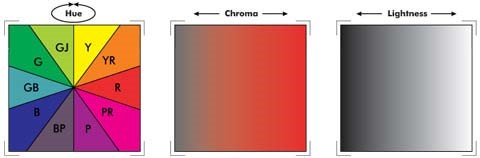
Three values are used to define a color: First is the hue, sometimes called shade, second is the chroma and the third is the lightness. Every color can be described using these three values and taking the type of light into consideration. This is the basis of colorimetry.
Different shades of color are arranged in a hue circle running clockwise from yellow through orange, red, violet, blue, bluish green and green back to yellow again. A color shade may be lighter or darker depending on its lightness. If the chroma of a color is reduced, then this color will be less brilliant (closer to gray). If the saturation is zero then we talk of an achromatic color. Black, white and all of the intermediate shades of gray are achromatic colors, determined by their lightness.
What is metamerism?
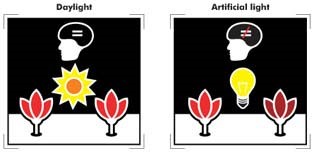
Everyone is familiar with this effect: a colored object appears to be one color under a given illuminant, (e.g. daylight), but appears differently under another illuminant such as the light from an incandescent light bulb. This change in color, which occurs frequently with almost all colored objects, has been erroneously called metamerism. But what is the true definition of metamerism?
We use the term metamerism when the colors of two objects under the same illuminant, e.g. daylight, (D65) are perceived to have the same color under one illuminant, such as daylight, but have different colors under a different illuminant, such as an incandescent light bulb. This is usually an unwanted effect. Just imagine you have a blue jacket and the materials used for the sleeves and back exhibit metamerism the jacket would look perfect in daylight, but in the evening in the light from an electric bulb the sleeves would appear to be a completely different color.
This effect can be explained clearly using the standard color values XYZ, which represent a color perception. Two samples are identical in a certain light if their XYZ values for this type of lighting are identical. This is the case when we have samples with identical spectral reflectance curves. However, metameric samples have different spectral reflectance curves. The two curves will have the same X, Y and Z values and have the same color under one illuminant, but different X, Y and Z values and different colors under a different illuminant.
What is influencing instrumental color measurement?
The spectrophotometers of today are very precise measuring instruments giving very accurate results that can be reproduced over and over again. It is not possible to deceive a measuring instrument in the same way as can often happen with a human observer. Use the figure on the left to see the effects of the background on identical gray dots.
Although the measuring instruments are very accurate, instrumental color measurement can be adversely affected by factors such as temperature, humidity and sample preparation. Temperature and humidity should therefore be monitored and a reproducible sample preparation process required in order to avoid measuring errors. This means, for example, that samples should be sufficiently conditioned before measurement so that temperature and humidity remain constant during measurement. Figure 2 shows how a temperature difference of 10°C can change the color of a sample. This would lead to completely different color values for one and the same sample.
Colorimetric Fundamentals
CIE 1976 L*a*b* (CIELAB)
The CIE 1976 L*a*b* color space is the most widely used method for measuring and ordering object color. It is routinely employed throughout the world by those controlling the color of textiles, inks, paints, plastics, paper, printed materials, and other objects. It is sometimes referred to as the CIELAB color difference metric.
The 1976 CIELAB color space is a mathematical transformation of the colorimetric system first published by the CIE in 1931. Both the 1931 and 1976 color spaces share the same fundamental principles, that:
The 1976 CIE L*a*b* system offers the following important advantages over the 1931 system:
The 1931 CIE system offered users the ability to describe and order colors. Through its system of color coordinates and associated diagrams, the CIE system also facilitated the comparison of colors. Graphical and numeric data were used to describe colors (and differences) using functions such as: Y, x, y, purity, and dominant wavelength.
Although the 1931 system proved useful, its practical application was limited as it did not express differences between colors in a uniform perceptual manner. The visual perceptions of differences (in lightness, purity, and dominant wavelength) were not usually consistent with the numeric information available from the system.
1976 CIE L*a*b* – perceptual uniformity
The 1976 CIELAB system improved on the 1931 system by organizing colors so that numeric differences between colors agreed consistently well with visual perceptions. This improvement facilitated and simplified the communication of color difference information between parties.
Opponent color coordinates
The method of describing (and ordering) colors by an opponent-type system has proven to be useful, and widely accepted. This approach follows the idea that somewhere between the eye and the brain, information from cone receptors in the eye gets coded into light-dark, red-green, and yellow blue signals. The concept follows the “opponent” basis that colors cannot be red and green at the same time, or yellow and blue at the same time. However, colors can be considered as combinations of red and yellow, red and blue, green and yellow, and green and blue.
In the CIE L*a*b* uniform color space, the color coordinates are:
L* – the lightness coordinate.
a* – the red/green coordinate, with +a* indicating red, and -a* indicating green.
b* – the yellow/blue coordinate, with +b* indicating yellow, and -b* indicating blue.
CIELAB – color system
The CIELAB color space can be visualized as a three dimensional space, where every color can be uniquely located. The location of any color in the space is determined by its color coordinates; L*, a*, and b*.
The L*, a*, b* color coordinates (of an object) are calculated as follows:
The L*, a*, and b* coordinate axis define the three dimensional CIE color space. Thus, if the L*, a*, and b* coordinates are known, then the color is not only described, but also located in the space.
Colors can also be described and located in CIELAB color space using an alternate method, that of specifying their L*, C*, and h* coordinates. In this method, the L* coordinates are the same as in L*a*b*, while the C* and h* coordinates are computed from the a* and b* coordinates. The same color is still in the same location in the color space, only there are two different ways to describe its position ( L*a*b* or L*C*h* ).
The L*C*h* color space is also three dimensional, however the color is located using cylindrical coordinates, as follows:
L* – the lightness coordinate, same as in L*a*b*.
C* – the chroma coordinate, the perpendicular distance from the lightness axis (more distance being more chroma).
h* – the hue angle, expressed in degrees, with 0° being a location on the +a* axis, then continuing to 90° for the +b* axis, 180° for -a*, 270° for -b*, and back to 360° = 0°.
Many CIE system users prefer the L*C*h* method of specifying a color, since the concept of hue, and chroma agrees well with visual experience.
CIE a*, b* chromaticity diagram
The a*,b* chromaticity diagram is a useful way to display the location of colors in the CIELAB color space. The colors can be located using either a* and b* coordinates, or C* and h* coordinates. In both cases, the L* coordinate is usually displayed separately, as a number.
Color differences in the CIELAB system
CIELAB color difference, between any two colors in CIE space, is the distance between the color locations. This distance can be expressed as delta E CIE L*a*b*, where:
DE* = (DL*2 + Da*2 + Db*2)1/2 .
DL* being the liqhtness difference.
Da* being the red/green difference.
Db* being the yellow/blue difference.
For those preferring to express differences in chroma and hue terminology, instead of da* and db*, the following terms are utilized:
DC* being the chroma difference.
Dh* being the hue angle difference.
DH* being the metric hue difference.
DE* = (DL*2 + 1DC*2 + DH*2)1/2
The DE* and DL* differences are the same, whether using L*a*b* or L*C*h*.
Color tolerances in the CIELAB system
The CIELAB system is often used to facilitate the quality control of colored products. In these cases, the color of the production sample is located in CIELAB space, and compared to the color standard for production. Color differences between the production sample and standard are computed, and then usually compared to the limits (tolerances) of customer acceptability for the colored product.
Acceptability tolerances are usually established between a supplier and his customer, based on historical experiences, and commercial factors. The CIELAB system is often utilized to help order and quantify the acceptability tolerances, for each customer and color combination.
When establishing acceptability tolerances, it is usually best to determine separate tolerances for dE*, dL*, da*, and db* (or dE*, dL*, dC*, and dh*). The separate tolerances allow the CIE system to be employed in acceptability applications, even as the customer acceptability criteria deviate from the uniform perceptibility of CIELAB color space.
Spectrophotometers
Tips for Optimal Performance
Spectrophotometers designed specifically for the measurement of colored materials, are at the center of any modern color formulation, color production, or color quality control system. Although these color spectrophotometers are designed to measure samples both accurately and repeatably, they accomplish these measurements only within a range of applicable tolerances. Spectrophotometers are not perfect measuring devices, and how well they measure is often dependent upon factors under the control of the system operator.
The purpose of this document is to provide “tips” (recommendations) on how to better operate and control color spectrophotometers, so that their measurements are as accurate and repeatable as possible.
These tips are intended for those attempting to get the best possible measurement performance from their color measuring spectrophotometer(s). They do require an investment in time and care, and one must decide if implementing some (or all) of these tips is worth the effort.
These tips are suggested to those who are attempting to maximize the accuracy and repeatability of their color measurement operations. In many cases, failure to follow specific tips may have little or no effect on overall system performance, since correctable measurement errors may be much smaller than the color acceptability tolerances involved.
No matter how well the color spectrophotometer is maintained and operated, its performance is limited to its inherent capabilities. Therefore, it is best to:
Summary of Color Spectrophotometer Tips
More about the recommended tips:
1. Qualified regular preventative maintenance will assure that the spectrophotometer’s integrating sphere coating is within acceptable reflectance parameters, and that the instrument continues to operate within specification.
Metamerism
Metamerism is a basic and most important aspect of color technology. Its effects are of concern and importance in many color formulation and production applications. Although light sources and objects that transmit light may exhibit metamerism, this document is concerned with objects reflecting light.
Metamerism should be considered within the context of the CIE colorimetric system. This system is based on the premise that the stimulus for color is provided by the proper combination of a source of light, an object, and an observer. The sensation of an object’s color is produced by the combination of:
The combination (light/object/observer) can be expressed as the CIE Tristimulus Values, coordinates of color sensation, computed using the following:
Metamerism – Terminology and Definitions
Metamerism always involves a pair of objects. The two objects can be described as “metameric objects”, or a “metameric pair”. They are sometimes said to be “metameric”, “exhibit metamerism”, and/or be “metameric matches”.
Metameric Objects exhibit the following:
Metameric Pair – An Example
Reflectance data for a metameric pair of objects is plotted in the following graph as spectral curves. These objects are called Metamer Standard and Metamer Batch. Note that the curves cross each other at least 3 times, which is typical for metameric objects.
Illuminant or Observer Metamerism?
There are two types of metamerism; illuminant and observer. Either one can result in unacceptable colored products.
Illuminant metamerism occurs when a pair of objects match under one light source, but do not match under one or more other light sources. This can result in products that match under production light conditions, but do not match under light sources where they may be sold and/or utilized.
Observer metamerism occurs when a pair of objects match for one observer, but do not match for another. This situation can occur when production matching is done under one of the CIE observers (2° or 10°), and subsequent evaluation done under the other. It also can occur in visual product assessment situations where the color sensitivity functions of those evaluating the match differ from one another.